The Bill Nobody Talks About
Charging infrastructure can cost as much as the trucks. And nobody’s figured out who pays for it yet.
The conversation around electric trucks centers on the vehicle: range, efficiency, sticker price. But there’s a second cost that gets ignored — the infrastructure required to actually charge them. Chargers, electrical work, transformer upgrades, utility service extensions, and ongoing energy and demand charges. The NACFE puts it plainly: “charging infrastructure is just one part of a system integrating your vehicle needs, electricity rate structure, and the timing and cost of bringing additional electricity to your site.”[3]
For a small pilot, the costs are manageable. But as fleets scale from 5 trucks to 50, the math changes fast. And that’s where this gets interesting for real estate: charging infrastructure is becoming a lease-negotiation issue.
What Charging Infrastructure Actually Costs
The Drive Electric Minnesota coalition breaks total cost into four categories: upfront hardware, electricity upgrades, energy charges, and demand charges.[1] Each one scales differently, and each one hits a different party’s balance sheet.
1. Charger Hardware
The charger is the most visible cost, but it varies wildly by power level. Level 2 (AC) chargers work for lighter vehicles returning to base overnight: $2,700–$24,000 per unit.[1] Class 7 and 8 trucks need DC fast chargers (DCFCs), which run $28,000–$150,000 per charger plus $18,000–$138,000 in installation.[1]
UC Davis modeled specific hardware costs at three power tiers: $30,000 for 50 kW, $81,000 for 150 kW, and $140,000 for 350 kW (in ~2018 dollars; current pricing is likely 20–30% higher).[4]
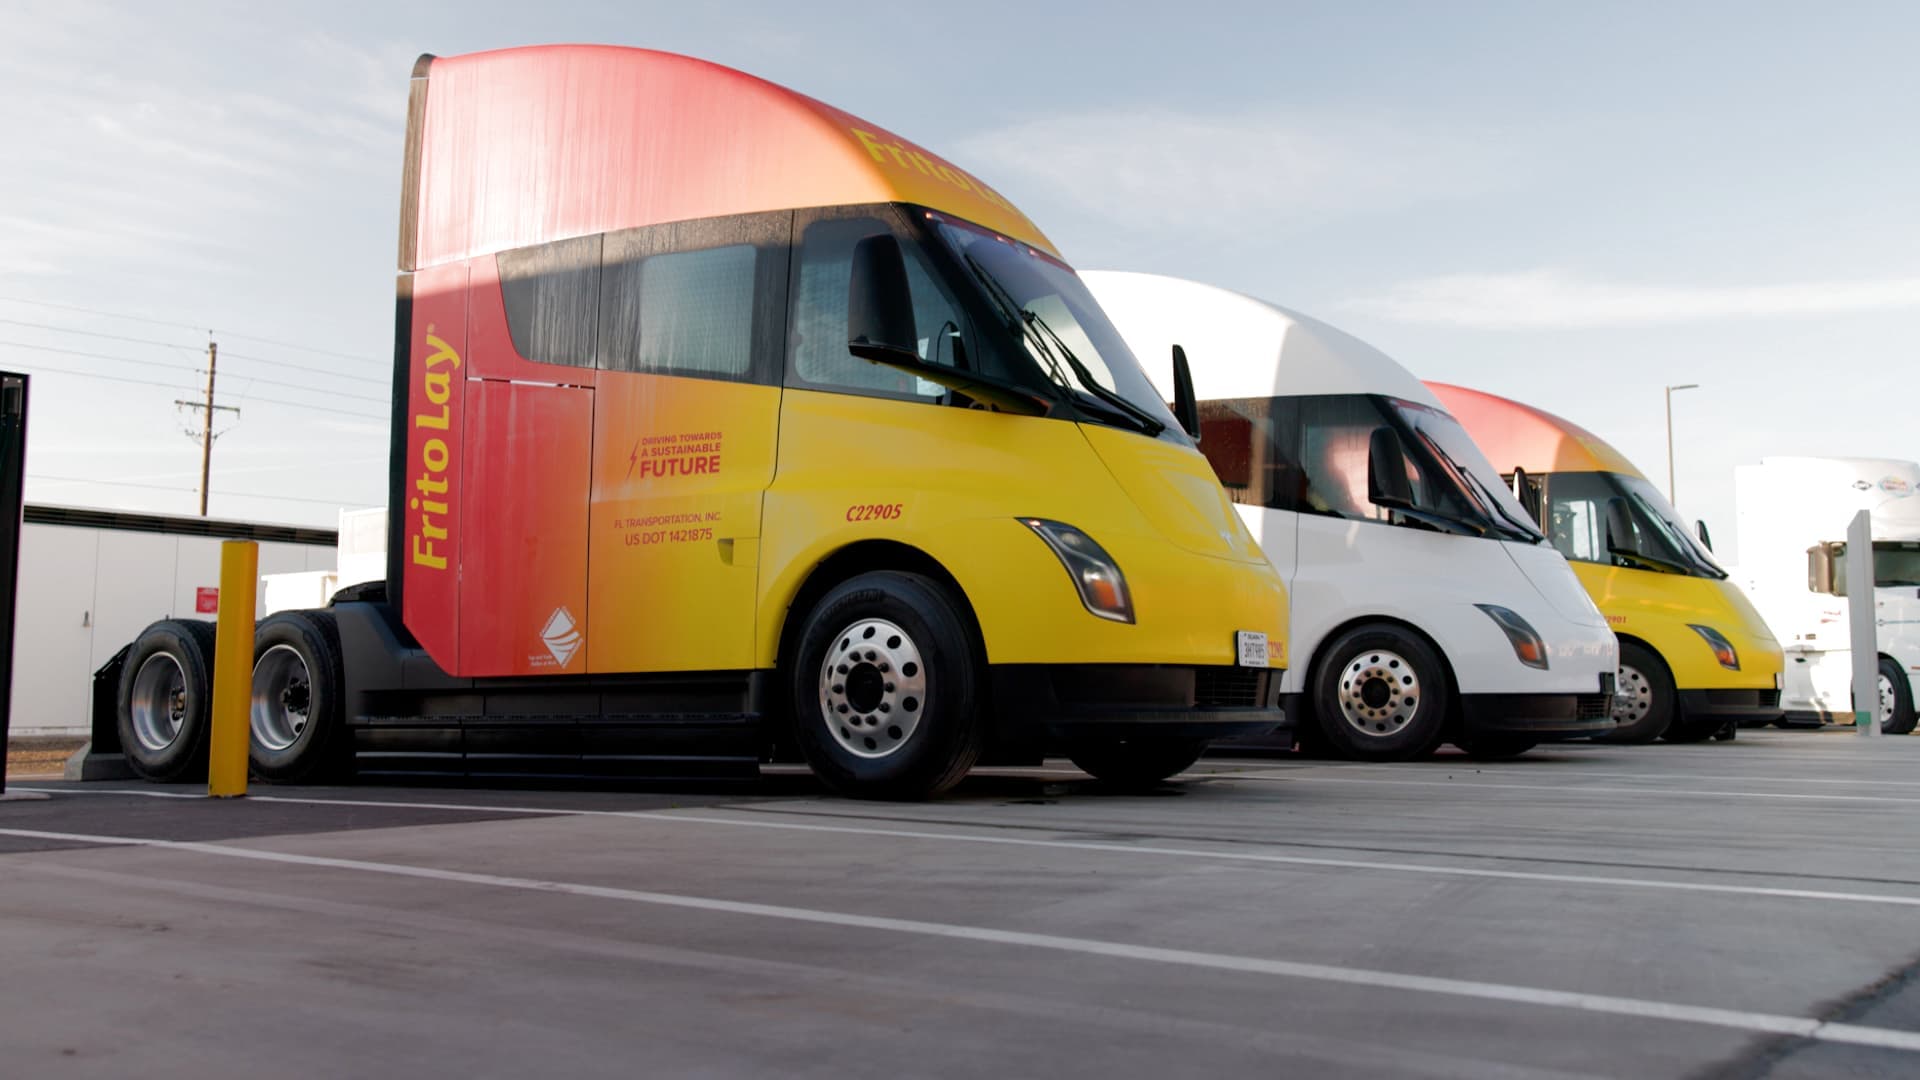
Even more powerful Megawatt Charging Systems (MCS) are hitting the market now. Tesla’s Megacharger network, ChargePoint’s MCS launch, and Kempower’s 1.2 MW units all went live in 2026. These are purpose-built for heavy-duty long-haul trucks like the Tesla Semi and Daimler eActros 600.
DC Fast Charger Costs by Power Level
Hardware cost per unit. Installation, trenching, and electrical work are additional. [4]
2. Electrical Upgrades
This is where costs escalate. Adding high-power chargers to a building’s electrical system often means panel upgrades, new conduits, trenching, and transformer replacements. The scope depends on what the facility already has and how much load you’re adding.
Worst case, the California Electric Transportation Coalition estimates grid-side upgrades at a large site could run $150,000 up to $6–9 million.[1] But real-world deployments come in much lower. NACFE’s Run on Less study tracked fleets like Schneider (92 trucks) and NFI (50 trucks) deploying at scale without hitting those extremes.[3] ICCT’s 2025 analysis found total utility-side costs of $2.5–$2.9 million across sites, but with utility incentive programs and cost-sharing, fleets typically pay $150,000–$500,000.[10]
UC Davis found transformer costs range from $44,000 for smaller units to $119,500 for larger ones (~2018 dollars; adjusted for inflation, $53,000–$143,000 in 2026).[4] Utility service extension adds $17,500 as a base cost plus $3,500 per charger beyond five.[4]
The good news: many utilities now offer “make-ready” programs covering 50–100% of the infrastructure work on the building’s side. That shifts a huge chunk of the burden off building owners and tenants.
Potential Grid Upgrade Costs
Theoretical maximum costs at a high-demand CA site. Utility make-ready programs often cover 50–100% of distribution/substation upgrades. [1][4]
3. Energy Charges
Electricity costs vary by region, utility, and time of day. UC Davis uses a California commercial rate of $0.20/kWh as its baseline.[4] But time-of-use (TOU) and EV-specific commercial rates create real savings. Minnesota Power’s commercial EV rate drops to $0.061/kWh off-peak vs. $0.156/kWh on-peak — a 2.5x differential.[1]
Smart charging software schedules vehicles to charge during off-peak windows automatically. NACFE says managed charging “should be used to control electricity costs” and can pay for itself through energy savings alone.[3]
Electricity Rates: Time-of-Use vs. Standard (Minnesota Power)
Choosing the right rate structure can cut charging costs by more than half. [1]
4. Maintenance & Networking
Chargers need upkeep. Basic maintenance runs up to $400/year for L2 and over $800 for DCFCs.[1] But the realistic number for commercial fleet operations is $2,500–$3,000+ per year per DCFC, including networking fees, software subscriptions, and service contracts.[4]
Demand Charges: The Biggest Surprise on the Bill
Of all charging costs, demand charges are the one that catches operators off guard.
Unlike energy charges (based on total electricity consumed), demand charges are based on the highest power draw during any 15-minute window in a billing cycle. One peak sets the demand charge for the entire month. Rates run $10–$20+/kW, and without management, they can become the largest line item on a fleet’s electricity bill.[1]
Here’s how it works: say your utility has a 500 kW demand threshold and charges $20/kW for overages. Two trucks charge at 300 kW simultaneously. The combined 600 kW draw exceeds the threshold by 100 kW, setting a demand charge of $2,000 for the entire month. The key word is “sets.” One overlapping session spikes the bill. Staggered or managed charging can eliminate this almost entirely.[1]
In California, commercial demand charges historically averaged around $17/kW per month, though the landscape is changing fast.[4] Many California utilities have moved to subscription-based EV rates that replace traditional demand charges: PG&E’s BEV2 rate offers roughly $6.60/kW equivalent for loads above 150 kW, and SCE’s EV-TOU rates eliminated demand charges through at least 2029.[11] Outside California, traditional $10–$20+/kW charges remain common.
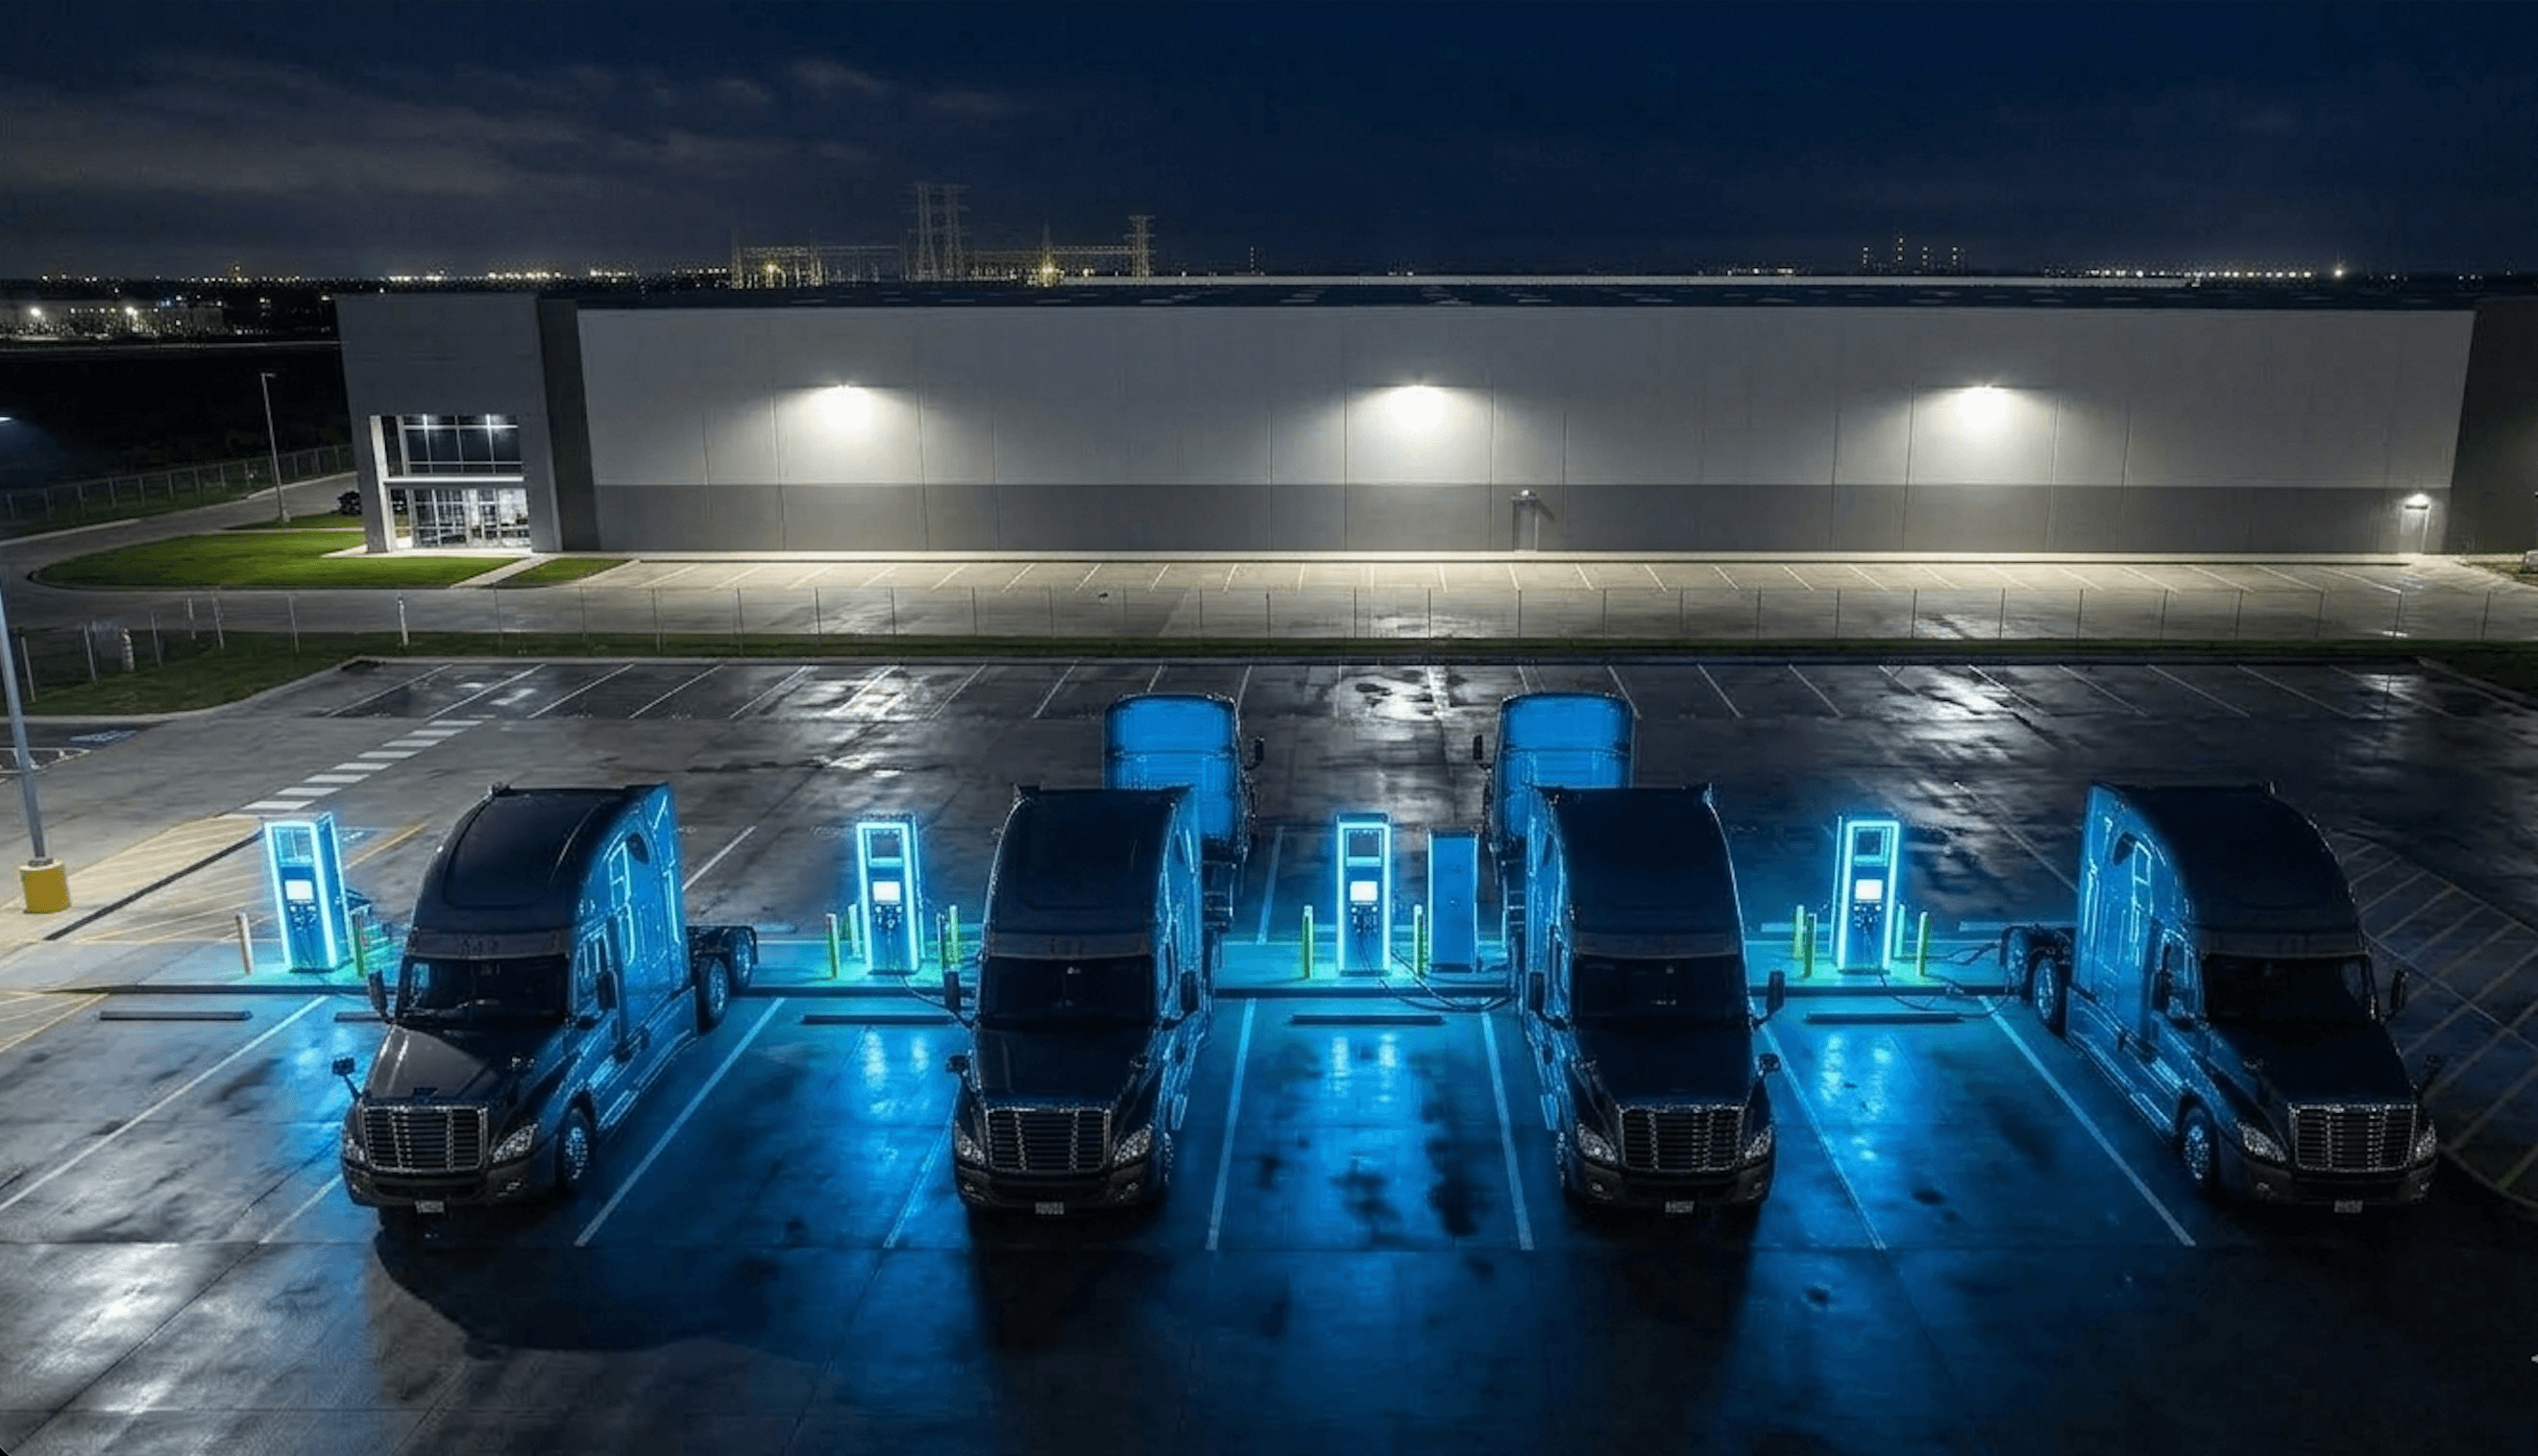
For a depot running 10 heavy-duty trucks on 350 kW chargers without management, peak demand could hit 1,500–2,000 kW. That translates to $25,000–$34,000 per month under legacy rate structures. But real-world fleets using managed charging and staggered scheduling keep peaks at 50–70% of theoretical max. PepsiCo’s Sacramento site (21 Semis, 3 MW service) uses managed charging and reports roughly 40% demand-charge reduction. Real fleets consistently report 40–80% savings through active load management.[3]
How Demand Charges Scale with Fleet Size
Unmanaged worst-case demand charges at $17/kW (CA avg). Managed charging can reduce these by 50–80%. [4]
Why this matters for leases: Demand charges are billed to whoever holds the utility account — usually the building owner or landlord. If a tenant installs EV chargers and creates high peak-demand events, demand charges spike for the entire facility, including loads unrelated to EV charging. That makes demand management a shared problem between landlords and tenants, and it’s one of the main reasons charging infrastructure is becoming a lease-negotiation issue.
Who Pays: Landlords, Tenants, or Someone Else?
This is the question at the center of every new industrial lease negotiation involving electric fleets. The answer depends on the cost type, the lease structure, and whether third parties are involved.
The NACFE’s implementation roadmap lists “consult with key stakeholders early and often” as step two, and specifically includes the landlord alongside the utility and truck manufacturer.[3] Their guidance is direct: “If you do not own your facility, talk with your landlord early.”[3]
EV charging infrastructure doesn’t fit neatly into traditional real estate cost categories:
| Cost Component | Typical Range | Who Typically Pays |
|---|---|---|
| Charger hardware | $28K–$150K per unit | Tenant (portable, leaves with fleet) |
| Installation (trenching, conduit, panels) | $18K–$138K per unit | Negotiated (often TI allowance) |
| Transformer upgrade | $53K–$143K (2026 est.) | Landlord via TI allowance or amortized into rent (stays with building) |
| Utility service extension | $17.5K–$35K+ | Utility make-ready program (50–100% covered) or landlord |
| Grid distribution upgrade | $150K–$500K typical | Utility (often 50%+ via make-ready/incentive programs) |
| Energy charges | $0.06–$0.20/kWh | Tenant (operational cost, passed through in NNN leases) |
| Demand charges | $10–$20+/kW/mo | Tenant via pass-through (NNN lease) or landlord (gross lease) |
| Annual maintenance | $800–$2,500/unit | Tenant or CaaS provider |
Most industrial leases are triple-net (NNN), so demand charges and energy costs pass directly to the tenant. Permanent electrical upgrades (transformers, panels, wiring) are trickier: TI allowances typically cover 50–100%, and landlords increasingly fold the rest into higher rent (5–10% premiums for EV-ready sites).
The real question is whether these upgrades add value or become dead weight. A $140,000 transformer upgrade makes sense if the next tenant also needs high-power capacity. If they don’t, it’s stranded capital. Prologis is making a clear bet: the company is building new facilities with “solar-ready roofs, electric vehicle-ready wiring, and microgrid-ready electrical switchgear” as standard features — not tenant-specific upgrades.[6] Their view is that power-ready buildings will command premium rents as electrification accelerates, and EV-ready capacity will be as expected as loading docks.
There’s also a growing role for third-party models. Charging as a Service (CaaS) providers invest in all the charging assets — hardware, installation, energy management — and charge the fleet operator a per-kWh or monthly fee. This removes the capital expense from both the landlord and the tenant.[3] Trucking as a Service (TaaS) takes it further by bundling the vehicle and the charging together, so the fleet operator simply reserves a charged truck at a specified time.[3]
“You want to try to future proof that infrastructure as much as possible while at the same time right sizing it.”
Ramiro Lepe, Medium & Heavy Duty Transportation Electrification Sr. Advisor, Southern California Edison[3]
How Costs Change as Fleets Grow
Per-vehicle infrastructure costs drop as fleet size increases — but only to a point.
For medium-duty delivery trucks using 150 kW chargers at 50% utilization, per-vehicle infrastructure costs fall from roughly $90,000 (at 10% utilization) to $28,000 (at 50% utilization) for a 20-truck fleet.[4] The cost curve flattens after about 50 vehicles for medium-duty and 10 vehicles for heavy-duty fleets. The biggest savings come from the first wave of scaling.[4]
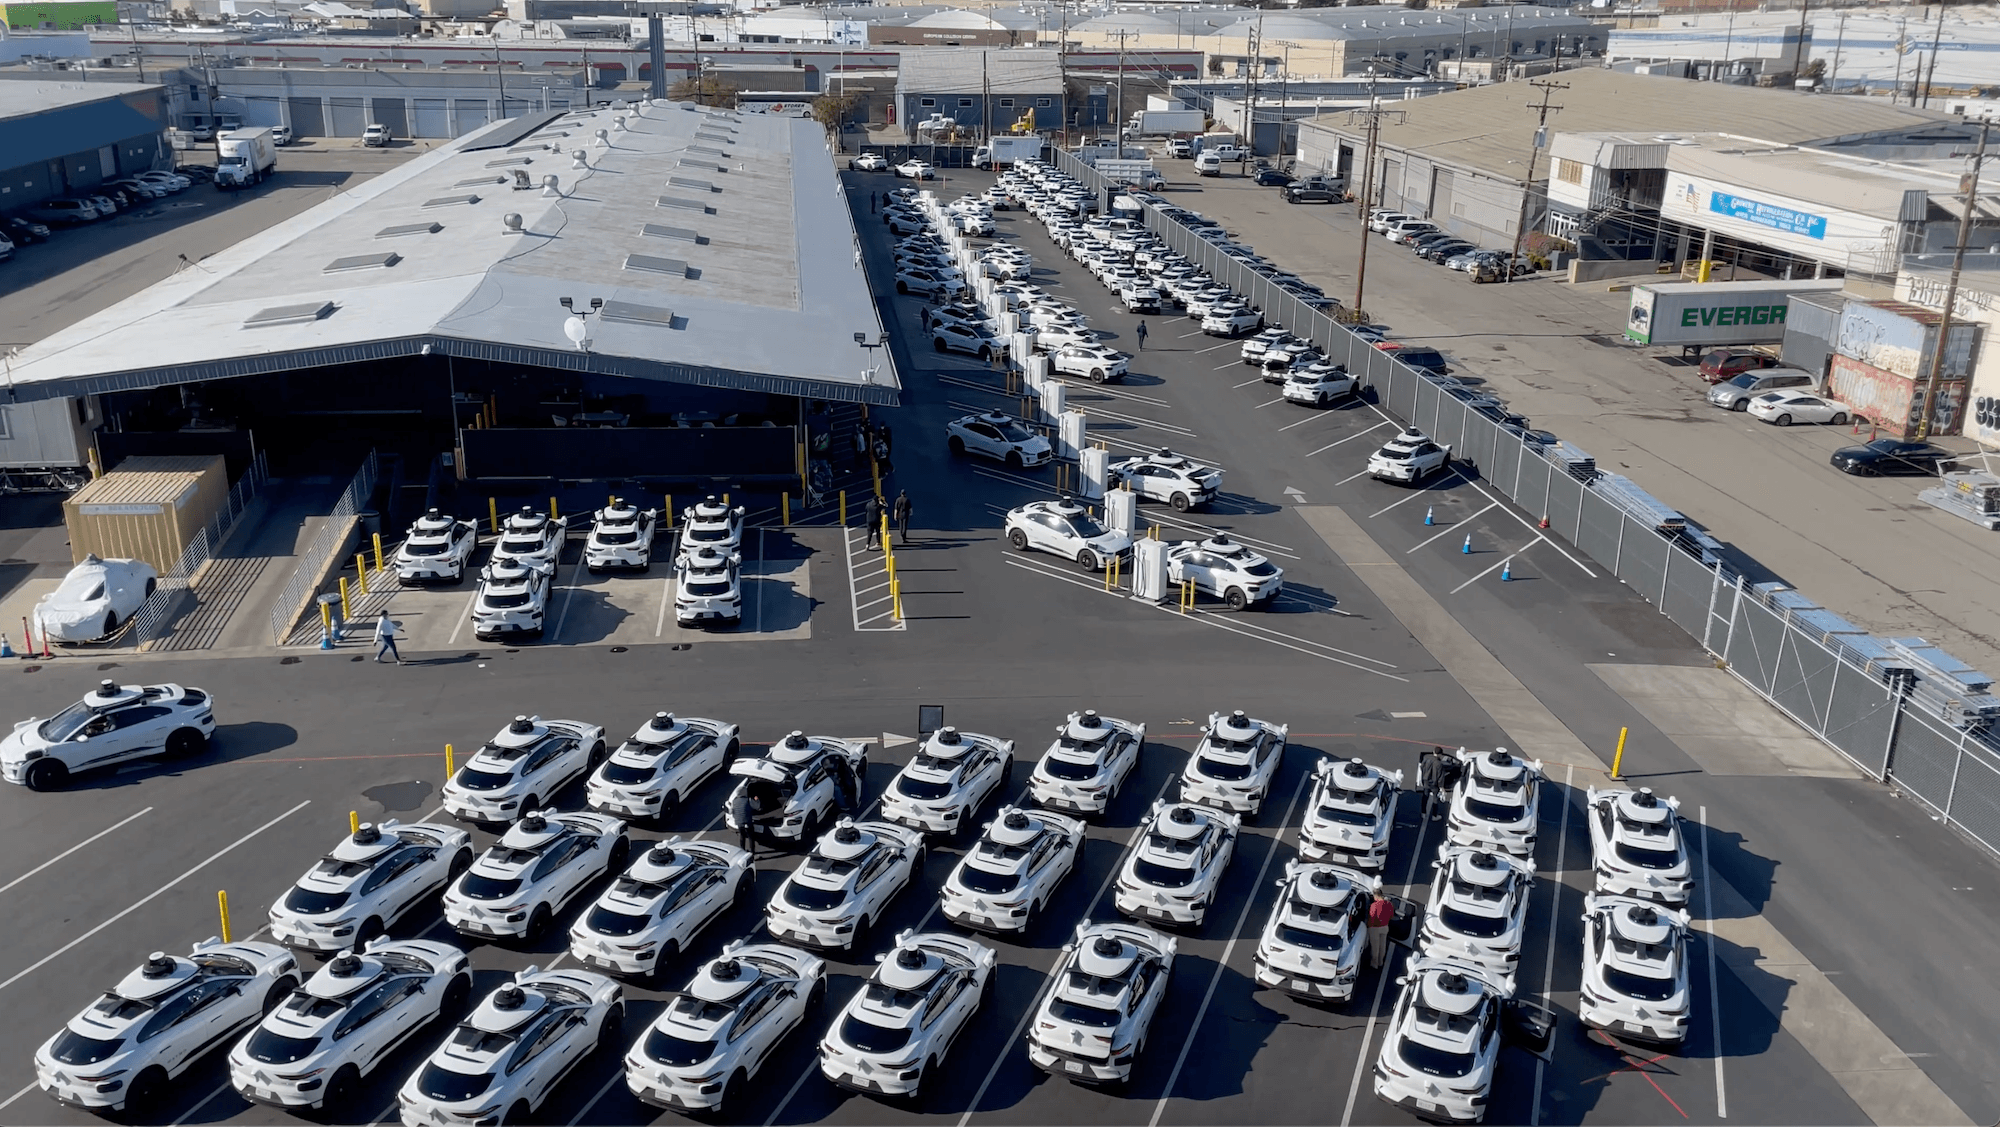
Real-world fleets are also reducing charger counts through higher utilization. NACFE data shows operators achieving 3:1 to 5:1 truck-to-charger ratios — US Foods runs 30 trucks on 6 chargers — pushing per-vehicle costs to $15,000–$20,000 at scale.
Per-Vehicle Infrastructure Cost by Fleet Size (150 kW Chargers)
Costs decline sharply with scale, but depend heavily on charger utilization rates. [4]
Utilization is the leverage point. Public fast chargers averaged just 1.8 hours of use per day in 2020, but that number doesn’t matter for fleet depots where operators control the schedule.[4] By 2026, well-managed depots run their chargers 6–12 hours per day (25–50% utilization), with smart charging software pushing some operations above 60%.
UC Davis found that while infrastructure costs are real up front, they’re ultimately dwarfed by ongoing electricity costs. For a fleet of 10 medium-duty delivery trucks, yearly per-vehicle cost (infrastructure + energy + maintenance) drops from $63,000 (1 truck) to $21,000 (10 trucks), with electricity making up the biggest share at scale.[4]
The takeaway: for 20 medium-duty trucks using 150 kW chargers, improving utilization from 10% to 50% cuts per-vehicle infrastructure costs from $90,000 to $28,000. Managed charging software that optimizes vehicle scheduling is one of the highest-ROI investments a fleet can make.[4]
How Smart Operators Are Cutting Costs
The costs are real, but they’re not fixed. Here’s what’s actually working:
Managed charging is the easiest win. Smart chargers connected to energy management software stagger vehicle charging to avoid simultaneous draws, cutting peak demand and the associated charges. They also shift charging to off-peak hours. Minnesota Power’s data shows this alone cuts energy costs by more than half.[1]
On-site solar and battery storage hit both energy costs and demand charges. Solar generates power during the day when rates are high; battery storage captures it for overnight charging or shaves peak demand during simultaneous charging events. Prologis reports that in several U.S. regions, their warehouse rooftop solar arrays generate more electricity than the building consumes, with excess sold back to the grid.[6] The company passed 1 GW of deployed solar and battery storage capacity in early 2026, making it one of the largest commercial solar operators in the country.
Utility engagement shows up in every source as essential. The NACFE report: “It is essential that you meet in person with your utility as soon as you begin thinking about electric trucks.”[3] Utilities often share upgrade costs, and many offer commercial EV rates or demand charge waivers during early adoption. As Oncor’s Jennifer Deaton put it: “The more information we have from the customers on what their 5-10-15 year electrification plans are, the more equipped that utility is to have those proactive conversations and try to make good EV rates.”[3]
Federal and state incentives cover real money. The IRS Alternative Fuel Vehicle Refueling Property Tax Credit provides rebates up to $100,000 per qualified property for fleets installing EV charging equipment in eligible census tracts.[1] State programs like California’s HVIP and CORE vouchers stack on top.
Cost Reduction Strategies and Estimated Impact
Estimated annual savings for a 20-truck depot. Strategies are cumulative.
The Infrastructure Is the Investment
California alone will need an estimated 151,000–156,000 chargers (depot and public) by 2030, rising to 434,000–460,000 by 2035 according to ICCT and CEC projections.[5] Roughly 85–90% will be depot chargers at private facilities — most of which are leased industrial properties. The remaining 10–15% will be en-route and public corridor hubs, growing as the National Zero-Emission Freight Corridor Strategy adds new sites through 2027.[5]
For building owners, the question is shifting from “should I invest in electrical capacity” to “can I afford not to.” Prologis research shows automation, electrification, and AI are pushing warehouse power requirements 3–5x higher than traditional facilities, with 76% of supply chain leaders expecting a 10–50% rise in energy needs over the next five years.[9] They’re already building new warehouses with EV-ready wiring, solar-ready roofs, and advanced electrical systems as standard. “Customers and communities,” they note, “are interested in industrial properties that are future-proof.”[6]
For fleet operators, the playbook is clear: start with a utility conversation, invest in managed charging software, design for higher charger utilization, and look at CaaS models that reduce upfront capital. The costs are real, but with the right planning, they’re manageable.
The bigger picture is this: electrical capacity is becoming one of the defining features of industrial real estate. The landlords and developers building that capacity now aren’t just accommodating today’s tenants. They’re positioning for a market where every logistics tenant will need serious power, and the buildings that have it will win.
Download the full report as PDF